Automated, on-demand benchmarking of Android Gradle builds with Github Actions
Slow build speeds are not unfamiliar to us Android Developers. It specifically becomes a nuisance when your codebase is large. Nowadays Kotlin is the preferred choice of development language for many developers(including myself). Since Kotlin is known to have larger build times then Java it becomes even more important keep a tab on those build times.
There are many build performance optimizations techniques and tutorials are available out there that one can apply to keep build speeds in check. However, one also needs to measure the efficacy of those optimizations. Benchmarking builds after every change can be a tedious and time-consuming task, again, especially for larger codebases. That’s where gradle-profiler and Github Actions come to our rescue.
In this article, I will explain how I built an automated, on-demand build benchmarking workflow using Github Actions. I specifically chose to make workflow on-demand and not continuous because it is unnecessary and suboptimal from a costing and carbon perspective. Ideally, you would want to check build times when you have introduced a new library, or changed some Gradle configuration or version, or did some refactor effort for modularisation, etc. It can also be determined at the time of code review whether a changeset can affect build speeds. That’s just my opinion though, I will also show how to run benchmarks on a continuous basis as well. Let’s begin.
About Github Actions
A lot has already been written about Github Actions integration with Android builds, but, for the sake of completeness I would like to put my interpretation in simple words. Github actions essentially provide you command-line access to a fresh computer with an operating system of your choice. You can program this computer via YML based workflow script. You can download your code on this computer, do a bunch of stuff with it, and then, you can also upload results back to your Github repository. You can even send them to your server via APIs and upload them to your Slack team. Possibilities are limitless when you have a whole machine to fiddle with :). What I like about this approach is reproducibility, because, every-time your workflow runs it starts on a fresh instance, hence the environment always remains constant.
One such complete workflow is called an Action which can be redistributed for other’s to use. Pretty cool! Github actions are event-driven which off-course integrate very well Github events like pull request, issue creation, comment, push, etc. We will use this integration when we build our own action to benchmark builds.
About Gradle Profiler
Gradle Profiler is a great tool for automating profiling and benchmarking information of Gradle builds. It takes care of the consistency and reproducibility of builds by running warmup builds before running actual measurement builds. Gradle-profiler can be used to benchmark any Gradle task, we will be using it to measure clean debug builds. There are two ways of using gradle-profiler.
First directly from command line like
gradle-profiler –benchmark –project-dir
Second
gradle-profiler –benchmark –scenario-file build_performance.scenarios –warmups 5 –iteration 10
Second is more convenient and more suitable for advanced scenarios. build_performance.scenarios file is a configuration file in which you can write different scenarios to benchmark. Here is a simple config that we will be using for purposes of this article
# Can specify scenarios to use when none are specified on the command line
default-scenarios = ["assemble"]

# Scenarios are run in alphabetical order
assemble {
    # Show a slightly more human-readable title in reports
    title = "Clean Build Debug"
    # Run the 'assemble' task
    tasks = ["assembleDebug"]
    cleanup-tasks = ["clean"]
}
Contents of this file are self-explanatory, we have essentially written the ./gradlew clean assembleDebug command in this scenario file.
Lets Begin
Let’s begin writing the Github action workflow now. We are going to create two jobs, one for the base branch and one for PR head commit. Here is exactly what we are going to do
Job 1
- Setup Trigger
- Clone Repo with PR head commit
- Install JDK, SDKMAN, and gradle-profiler
- Run the profiler
- Save results for later comparison and use
Job 2
- Repeat Step 2, 3, and 4 for the base branch this time
- Download results from Step #5 and run a Python Script to compare both
- Send results to Slack to your database or do whatever with it
Step 1- Setup Action Trigger
Since we want to run this action on demand we will be using Pull Request Comment Trigger action to listen for Pull Request comments. As soon as the triggering comment is posted action will start executing. I am using benchmark-build as a trigger phrase for this workflow. This action requires following the YML block in the trigger section of the workflow
on:
  issue_comment:
    types: [created]
After that, we can start writing our first Job
jobs:
  build-head:
    runs-on: ubuntu-latest

    steps:
      - uses: khan/pull-request-comment-trigger@master
        id: check
        with:
          trigger: 'benchmark-build'
Step 2- Clone repo with PR head commit
It’s a little tricky to get exact ref/sha of different branches when the workflow trigger is issue_comment because it does not contain the required information directly. But, thanks to pull-request-comment-branch action our life becomes easy.
Here is how it is setup
- uses: xt0rted/pull-request-comment-branch@v1
  id: comment-branch
  with:
    repo_token: ${{ secrets.GITHUB_TOKEN }}
GITHUB_TOKEN here is something which is used to access Github APIs. It is automatically added by actions for us. This action produces some helpful outputs, which we can use in the standard checkout action. For head commit, we need to use head_ref
# Clone head commit
- name: Clone Repo
  uses: actions/checkout@v2
  with:
    submodules: recursive
    ref: ${{ steps.comment-branch.outputs.head_ref }}
I have added submodules: recursive just in case your repo contains any submodules like one of my projects.
Step 3- Install Required Dependencies
We need JDK 1.8, SDKMAN, and gradle-profiler to build and benchmark Android build. SDKMAN is required to install gradle-profiler. Here are detailed instructions on it. The YML block looks like this. run is used to execute commands on a terminal.
# Setup JDK on container
- name: Set up JDK 1.8
  uses: actions/setup-java@v1
  with:
    java-version: 1.8

- name: Install SDKMAN, Gradle Profiler
  run: |
    curl -s "https://get.sdkman.io" | bash
    source "$HOME/.sdkman/bin/sdkman-init.sh"
    sdk install gradleprofiler 0.12.0
Step 4- Run Profiler
Somehow, I observed that gradle-profiler installation done in Step 3 was not available to the next step so I fired benchmarking in the same step only. That step now becomes
- name: Install SDKMAN, Gradle Profiler and Begin Profiling
  run: |
    curl -s "https://get.sdkman.io" | bash
    source "$HOME/.sdkman/bin/sdkman-init.sh"
    sdk install gradleprofiler 0.12.0
    gradle-profiler --benchmark --scenario-file build_performance.scenarios --warmups 1 --iteration 1
I have kept --warmups and --iteration values to 1 in order to do quick testing and prototyping. Please modify it as you see fit for your use case.
Step 5- Upload Result to Repo
After benchmarking is done we will be uploading the result from the docker container to the Github repo, so that, we can download and use it later. The result is stored in a folder named profile-out. Here is how another standard action upload-artifact can be used to do this
- uses: actions/upload-artifact@v2
  with:
    name: head-benchmark
    path: profile-out/benchmark.csv
Step 6- Run another job for the base branch
By default, if you specify multiple jobs in a workflow file they are started in parallel. In this case, I wanted the second job to start only after the first job has finished running. This is because
- There is no point in running the second job if the first fails.
- In async jobs it’s difficult to determine which finished when and then create a third job for running analysis on benchmark results.
- This will also save us some execution minutes and cost in turn in case of failure.
Here is how its configured
build-base:
  needs: build-head
  runs-on: ubuntu-latest

  steps:
    - uses: xt0rted/pull-request-comment-branch@v1
      id: comment-branch
      with:
        repo_token: ${{ secrets.GITHUB_TOKEN }}

    # Clone base commit
    - name: Clone Repo
      uses: actions/checkout@v2
      with:
        submodules: recursive
        ref: ${{ steps.comment-branch.outputs.base_ref }}
There are two things to notice here. First, needs: build-head tells actions that this job is dependent on the job with id build-head. Only when that job is a success this job will begin its execution. Second, steps.comment-branch.outputs.base_ref tells checkout action to pull the base branch and not head commit. After this, we need to repeat the installation steps like the previous job.
# Setup JDK on container
- name: Set up JDK 1.8
  uses: actions/setup-java@v1
  with:
    java-version: 1.8

- name: Install SDKMAN, Gradle Profiler and Begin Profiling
  run: |
    curl -s "https://get.sdkman.io" | bash
    source "$HOME/.sdkman/bin/sdkman-init.sh"
    sdk install gradleprofiler 0.12.0
    gradle-profiler --benchmark --scenario-file build_performance.scenarios --warmups 1 --iteration 1

- uses: actions/upload-artifact@v2
  name: Archive Benchmark Result File
  with:
    name: base-benchmark
    path: profile-out/benchmark.csv
Step 7: Download Previous result and Compare
We can download the file that we previously uploaded via another action called download-artifact. I am going to download that in a folder called profile-out-head in the following way
- uses: actions/download-artifact@v2
  with:
    name: head-benchmark
    path: profile-out-head
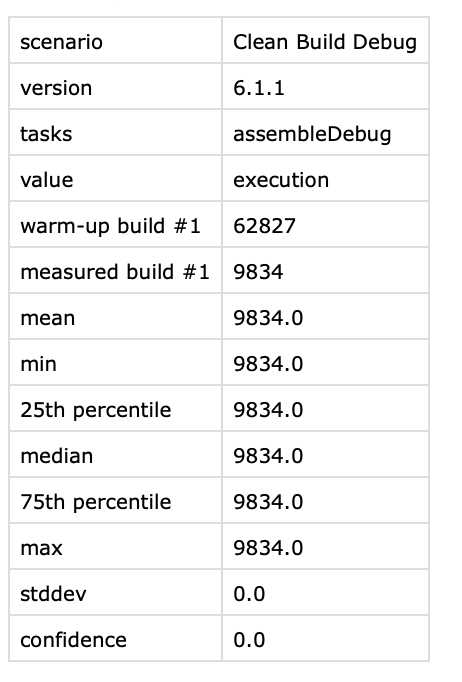
head-benchmark is the name that we gave this artifact in Step 5. Once we have both benchmark results on the file system you can write simple scripts in the language of your choice and do any processing per requirement. Output file is a simple CSV file which looks like this
Here is a python script that simply takes two benchmark files and prints out the mean execution time of build. This script also writes results in a file because it can then be used to send these results back to a Slack channel or comment on the PR itself.
import csv

def get_result(fileName):
    with open(fileName) as f:
        next(f)  # Skip the header
        reader = csv.reader(f, skipinitialspace=True)
        return dict(reader)

baseResult = getResult('profile-out/benchmark.csv')
headResult = getResult('profile-out-head/benchmark.csv')

baseMean = baseResult['mean']
headMean = headResult['mean']

buildStr = "Branch Head Build Time: " + headMean + " | Base Branch Build Time: " + baseMean
# print result on console and write in a file
print buildStr
with open("benchmark-result.txt", 'w') as f:
    f.write(buildStr)
This script can be used in workflow as follows
- name: Print Difference
  run: |
    chmod +x benchmark-difference.py
    python benchmark-difference.py
See it in Action
You can see the script and try it out for yourself by forking this repo. Here are a few screenshots for reference
-
Comment
benchmark-buildon PR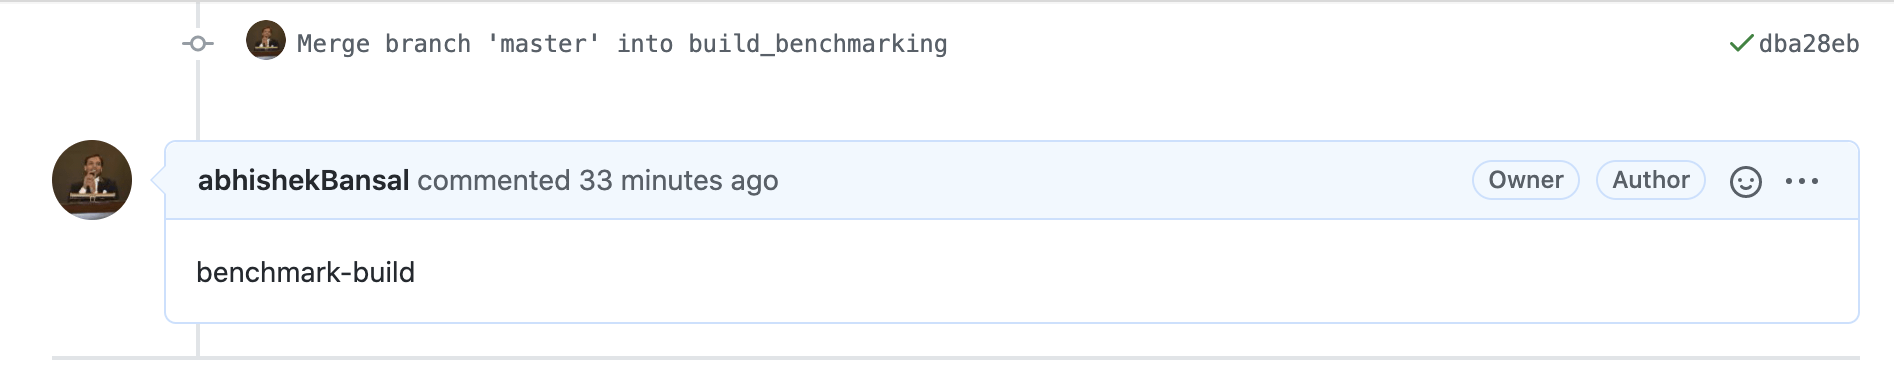
-
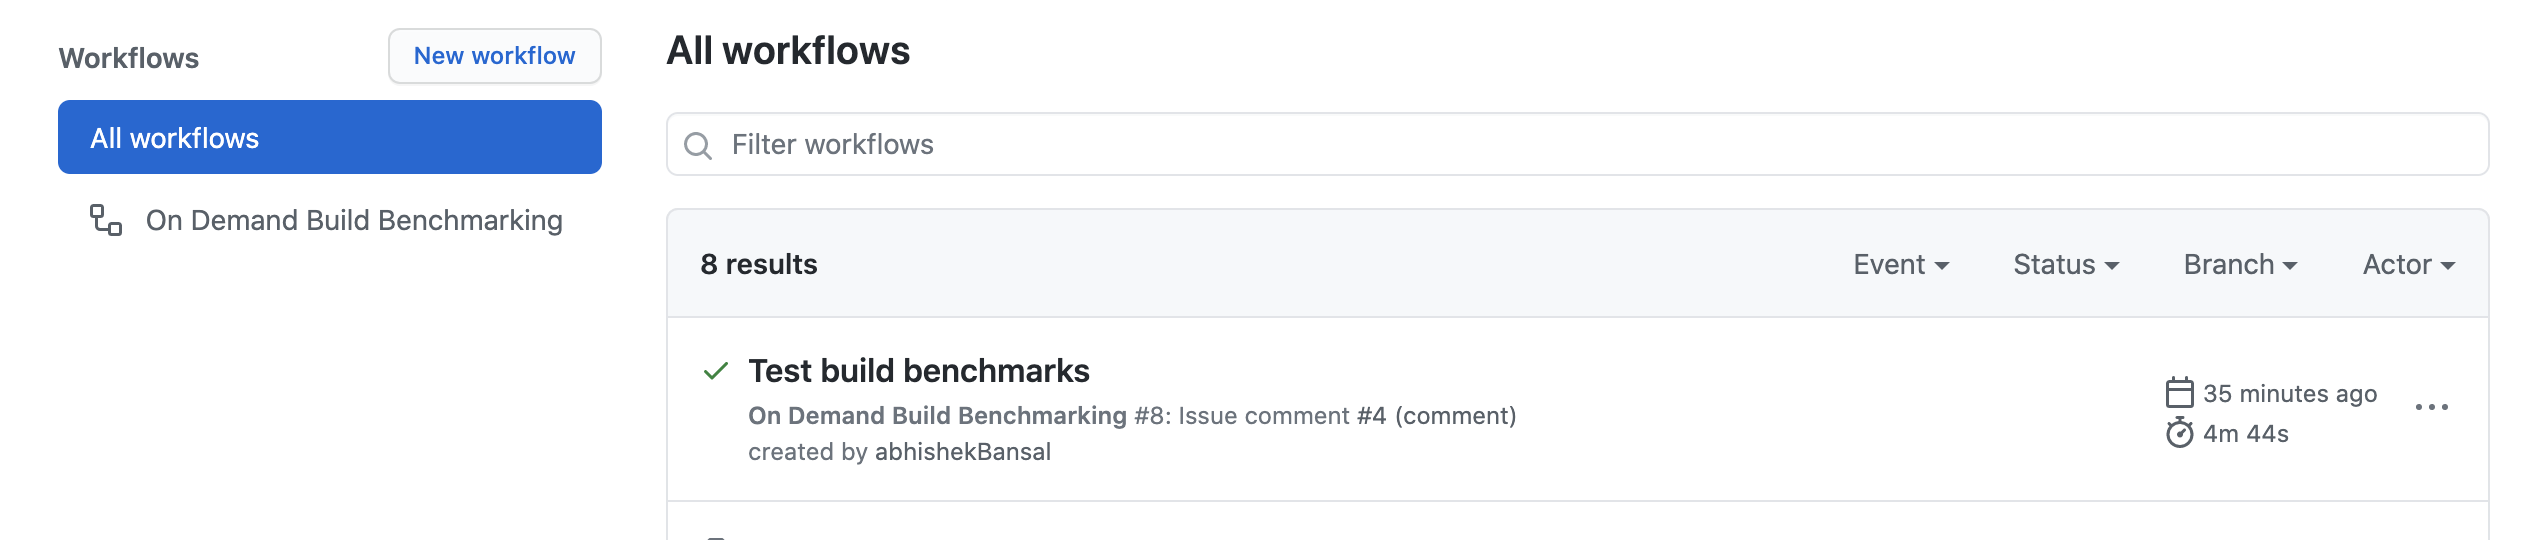
Github Action triggered
-
Execution and Result of Action
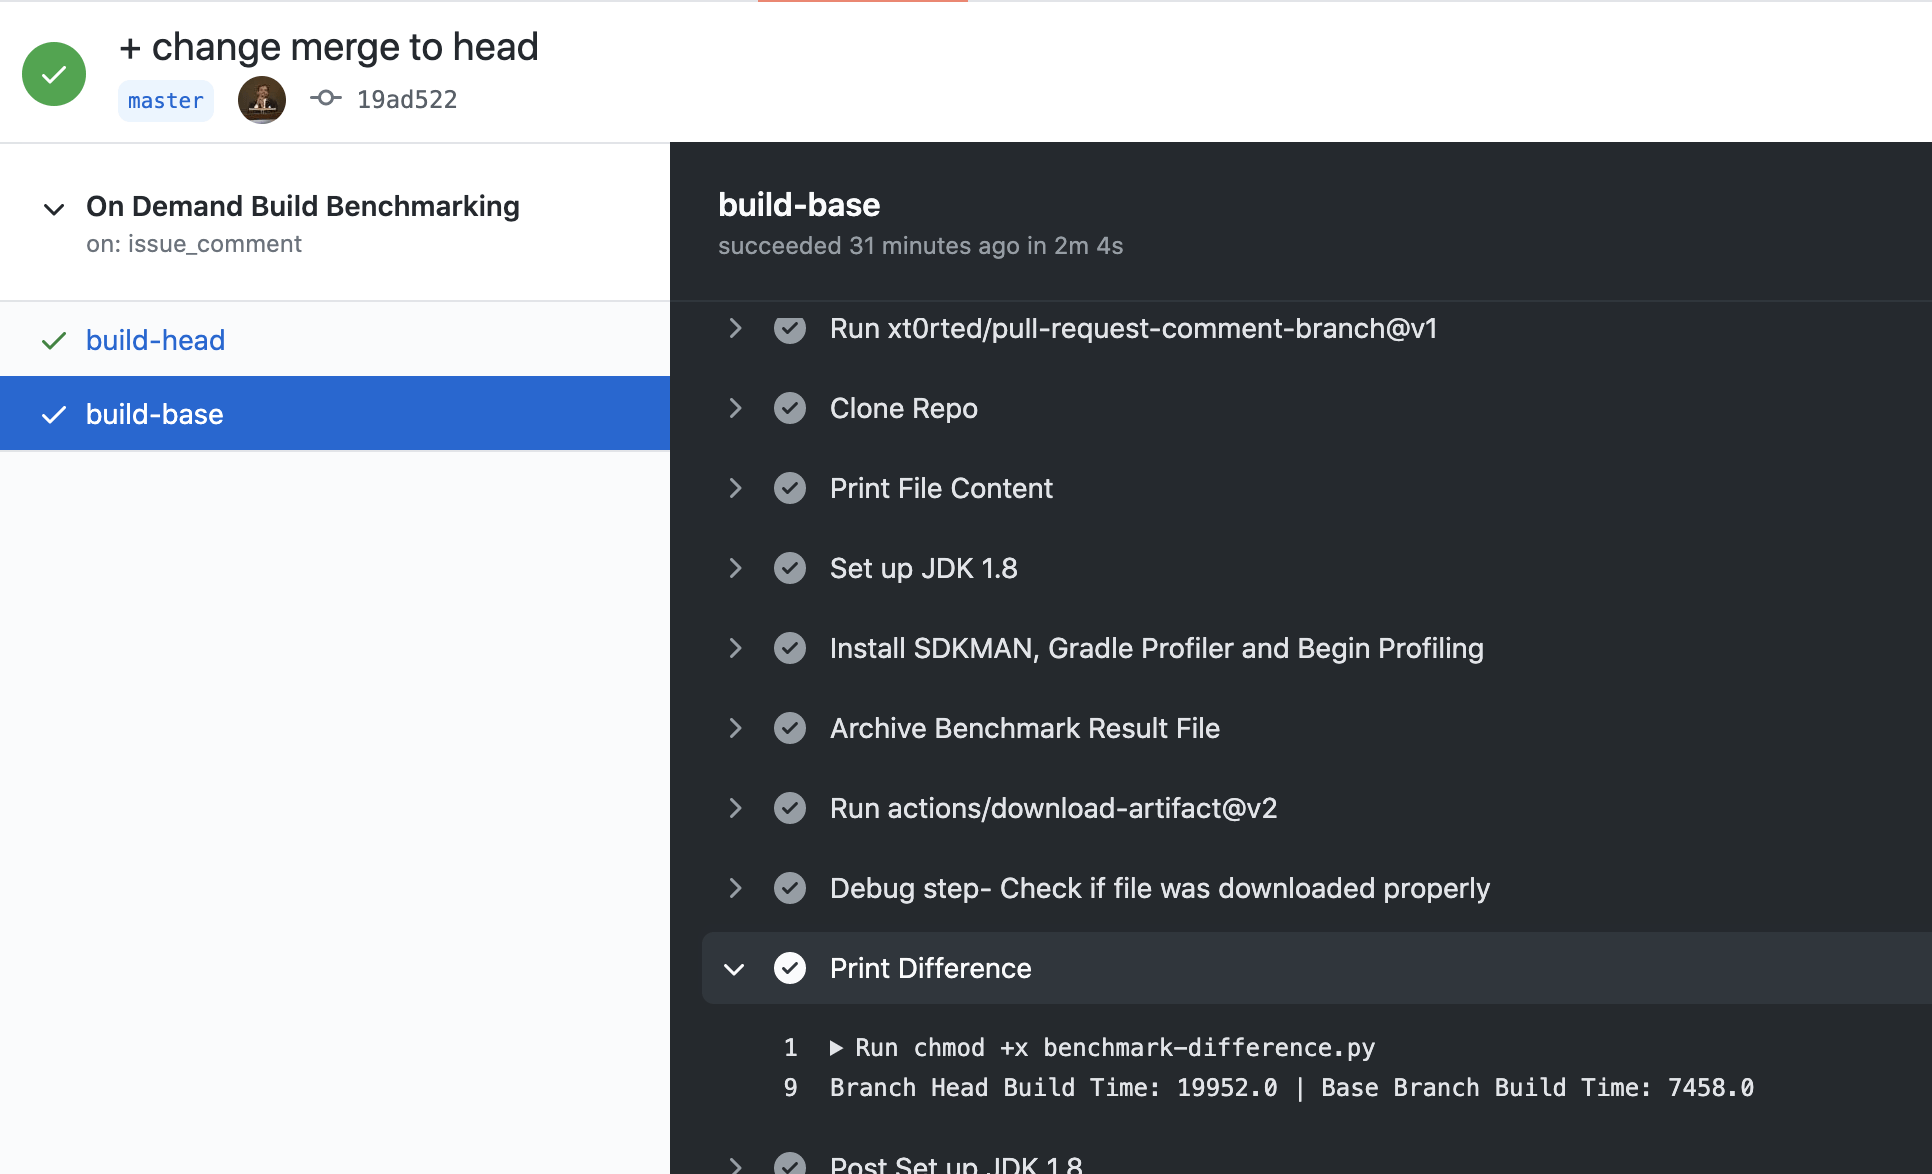
Note that for this example I had enabled minify which had a significant impact on build time, which explains more than double build time when compared to the base branch.
Github Code
You can find this workflow in action here.
That’s it, we saw how Github action’s simplicity combined with gradle-profiler’s goodness we were able to write a very useful workflow. I hope you find it helpful. If you have any thoughts or comments about this workflow do share it in comments.
All the best for your build times.
Note: I have specifically used gradle-profiler version 0.12.0 because I found that the latest version 0.15.0 no longer produces mean and other stats in the CSV file. I have filed an issue here. I will update the article as the issue is updated
Update on the above note: They have removed calculated stats in the latest versions as it’s evident from the above issue. However, this calculation can be performed in the python script. I will try to update the script and link that here.
Happy Coding!